blobly_net
The tool that drives and watches the stack. It exercises a system under test over CAN and CAN-FD, and over Ethernet with the automotive protocols that run on it: send and observe traffic, decode it, run diagnostics, script test cases, simulate ECUs and replay recordings. Virtual first, with real hardware as a drop-in.

sim-demo project: simulated ECUs on two in-process networks, the trace
decoded against their DBCs, and a live plot of three signals. The same project runs
headless from a script.
Any adapter on the bench
Every backend sits behind one bus interface, so a project written against a virtual bus runs unchanged on hardware.
| backend | platform | CAN-FD | verified on |
|---|---|---|---|
| in-process · UDP | everywhere | yes | no hardware at all; what the tests and the demo run on |
| SocketCAN | Linux | yes | vcan0 or any adapter the kernel drives |
| Vector XL | Windows | yes | VN1630A, to an 8 Mbit/s data phase |
| Kvaser | Windows | yes | USBcan Pro 5xHS, 64-byte frames at 500k to 8M |
| PCAN | Windows | yes | PCAN-USB Pro FD, cross-vendor against Kvaser |
| CANsub | Linux · Windows | yes | a USB network adapter: no driver, found by mDNS |
Listen-only means the transceiver too. A channel marked listen-only refuses to transmit in software, and on every vendor backend the controller is put in silent mode as well, so it stops acknowledging frames on the wire.
Each wire shows its bus load over the last minute and its controller's fault state (warning, error-passive, bus-off), and the toolbar carries the worst of them. On Linux a received frame is timed by the kernel's receive stamp, not by when the app got round to reading it.
Diagnostics you can script
A UDS client over ISO-TP and DoIP, in a panel and in Lua, that treats what an ECU answers as data rather than bytes.
-- tests/diag_advanced.lua, from the repo
local diag = uds.open("CAN1")

test("write then read back a DID", function()
  diag:write_did(0xF1AA, fromhex("CA FE"))
  check.equal(tohex(diag:read_did(0xF1AA)), "CA FE")
end)

test("the fault is confirmed", function()
  check.dtc(diag, "P1234-56",
            { confirmedDTC = true, testFailed = true })
end)
DTCs come back as records, with the code, its J2012 name and every status bit named, plus their snapshots and extended data. Functional addressing sends one request and collects every ECU's answer, on CAN and over DoIP.
Timing follows the server: P2 and P2* are read from the session answer, a response-pending is waited for, and an answer that does not match its request is discarded instead of being taken for the next one.
Flashing runs against a blobly_emb bootloader with authentication, from a script, the Flash panel or the command line.
The rest of the car, simulated
A system under test needs the bus around it. blobly_net plays that part in-process, from the same databases the target is built from.
Simulation
- Simulated ECUs send what their DBC says they send, at its cycle times, and answer UDS
- Generators sweep a signal: sine, sawtooth, counter, step
- AUTOSAR E2E Profile 1 stamped on send and verified on receive
- Fault injection: drop a message, corrupt its CRC, freeze its counter, push a value out of range
Replay
- MF4 and candump recordings, played at their recorded cadence
- Rest-bus: the ECU under test is subtracted from the recording, so it does not argue with itself
- Several buses from one clock, so a gateway sees the timing it polices
- Streamed a chunk at a time, for recordings larger than memory
Databases and protocols
What the bytes on the wire mean is decided once, in the engine, and shared by the GUI, the scripts and the command-line tools.
| layer | what blobly_net does with it |
|---|---|
| DBC | decode, encode and an editor that writes it back, with the E2E attributes both repositories share |
| AUTOSAR ARXML | read natively, one database per CAN cluster; exported to DBC for tools that cannot read it |
| J1939 | PGN and source address in the trace, transport-protocol messages rejoined, address claims followed |
| DoIP | tester and entity: UDS over TCP to a real ECU, or a simulated one to test against |
| SOME/IP | listen to a service's events, send to it and call its methods |
Inside the target
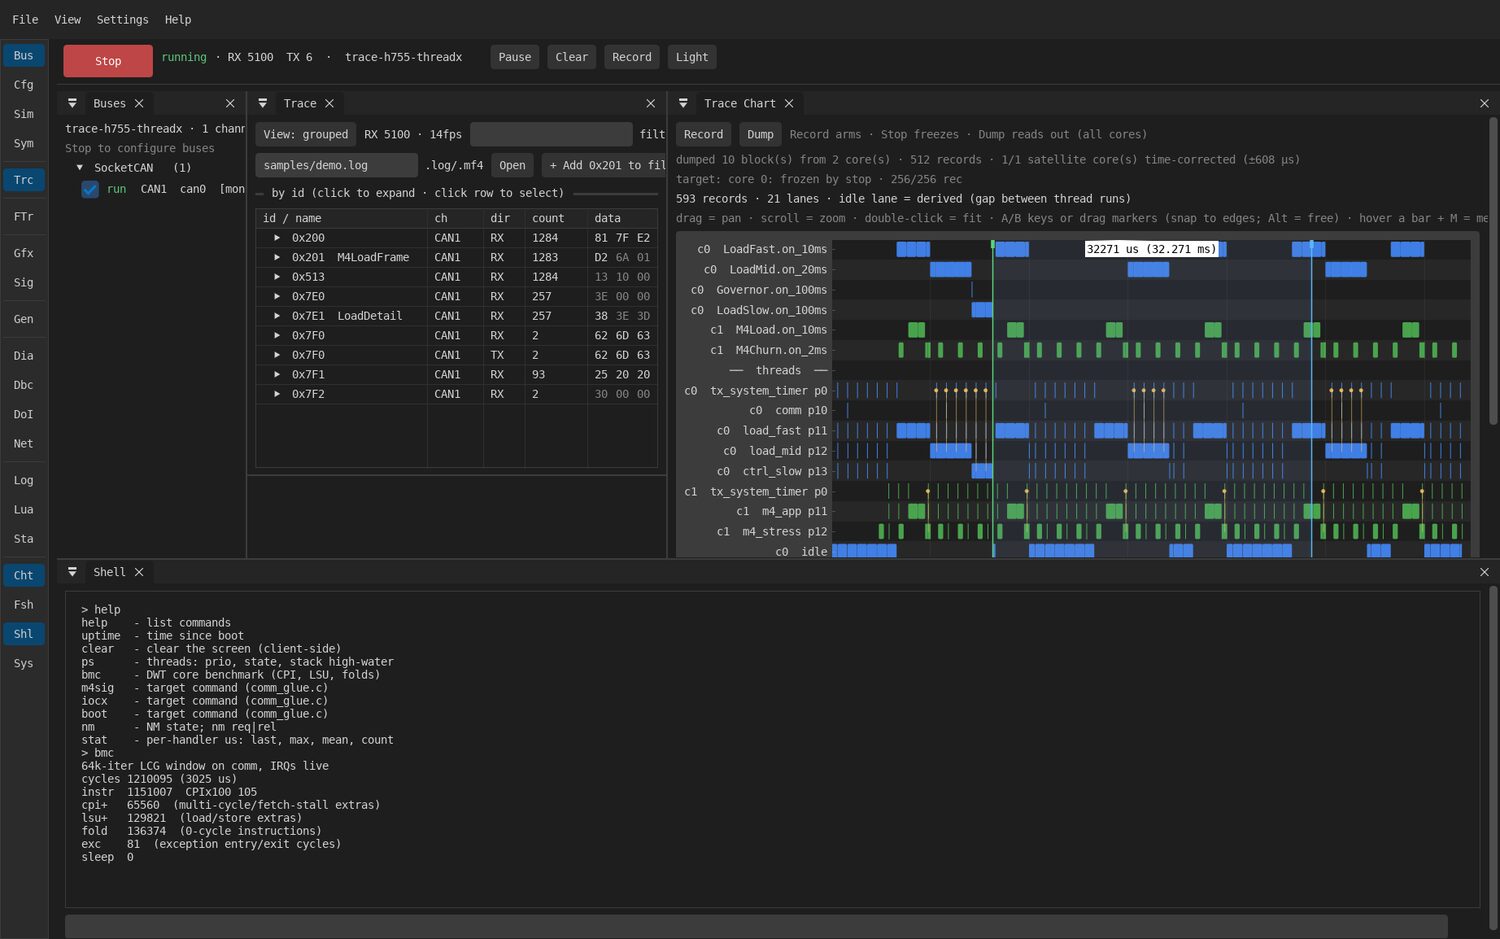
Against a blobly_emb board it reads more than the bus: the flight recorder, the system model, and a shell on the target.
It ships as a Linux AppImage, a Linux tarball and a Windows zip, built in CI from the same tagged commit. GUI and headless runs share one engine, so a test written at the desk runs unchanged in CI.